profileInfographics
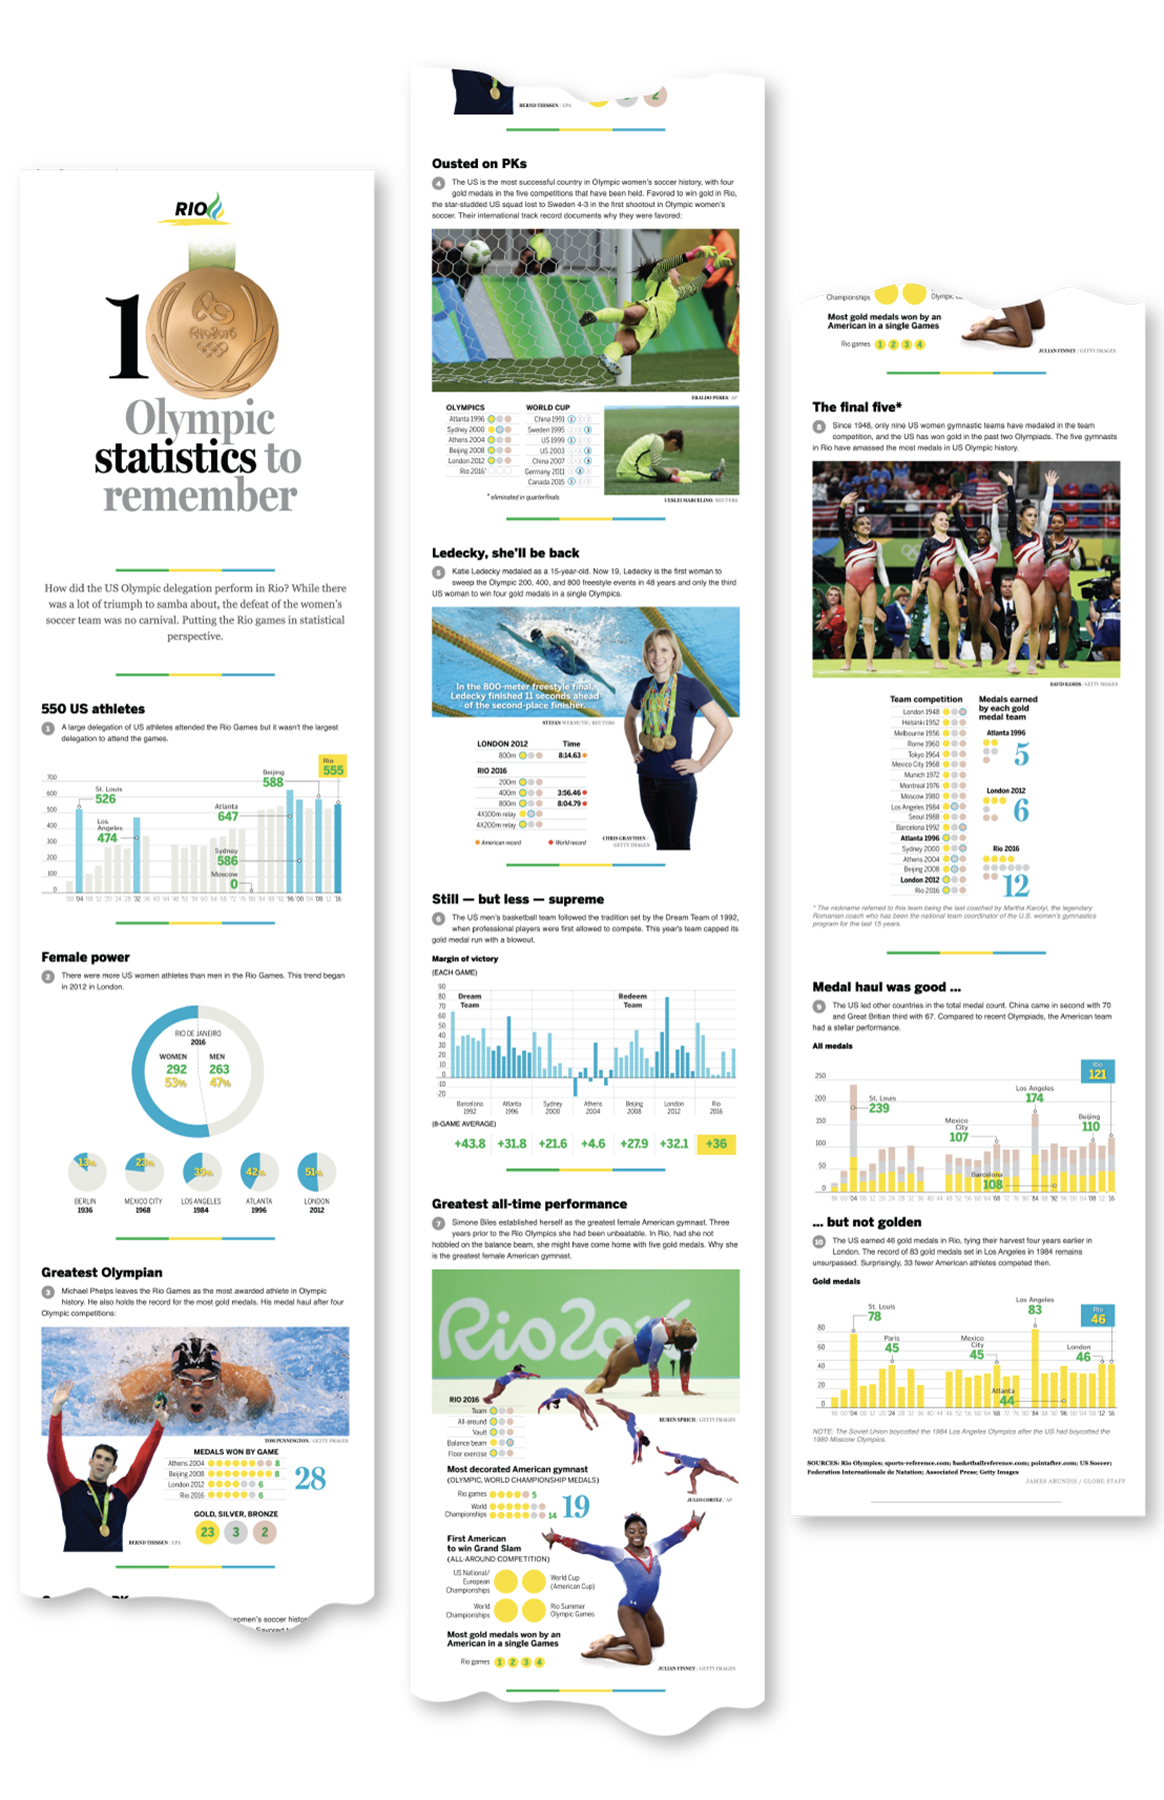
How did the US teams do at the Rio Olympics?
The Olympic Games, like other quadrennial sporting events, often leave lasting memories of the performances of individual athletes and national sport teams. American viewership of the Olympic Games is high over the 16-day competition. Our Olympic program is so strong, Americans expect to see breakout performances and for the US to dominate the Games.
Because many Americans are tuned in, broadcasters reward that captive audience by broadcasting the sporting event extensively. How extensive? Well, 7,100 broadcast hours in Rio 2016 compared to 5,600 in London 2012. There are only 384 total hours over the 16-day event.
This infographic had two objectives: One, to highlight those individual US athletic and team performances that stood out. In doing so, we helped readers remember why performances they watched over the two-plus weeks were spectacular.
The second, was to place what seemed like a stellar performance by the US Olympic contigent into context. Read the infographic to find out.

